

Report Canvas and Components
The report canvas is the main graphic work area that contains various components showing the results of executed queries.
Report Canvas Structure
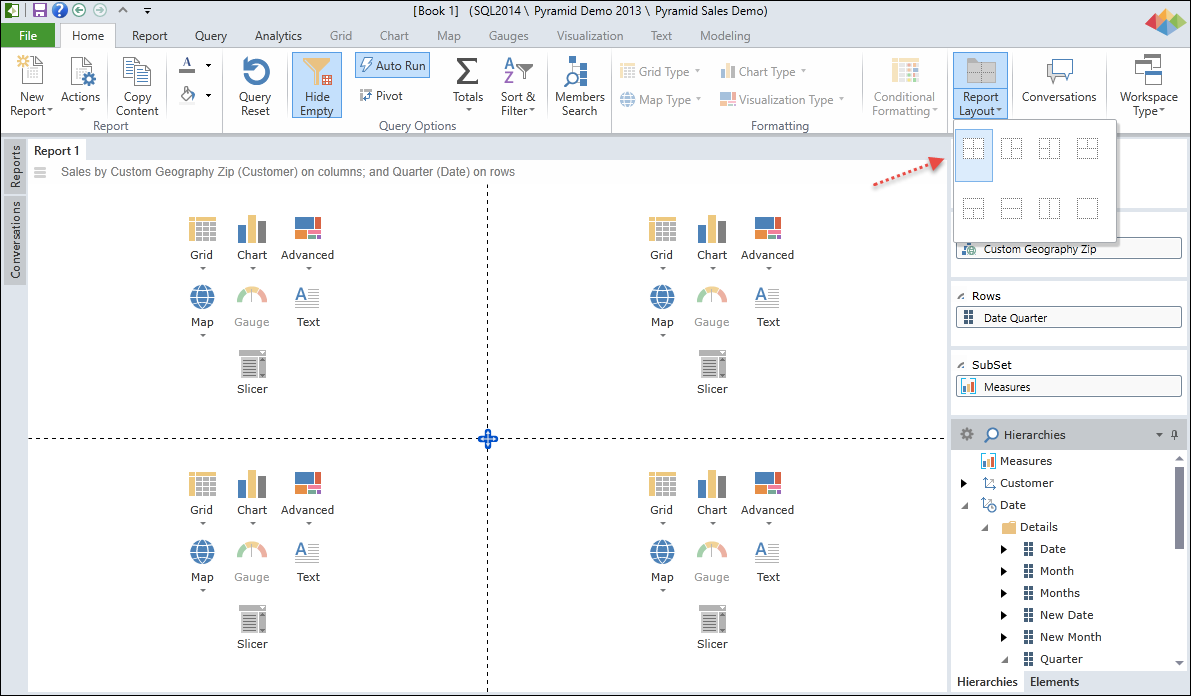
Use the Report Layout button in the Home Ribbon to select one of the eight report layouts, as shown below.
Report Canvas Panes
The report canvas has the following qualities:
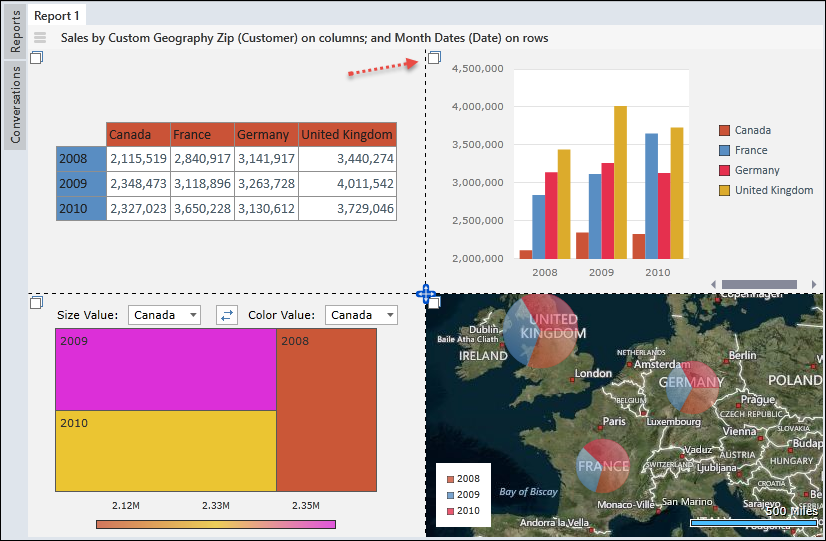
- The user can select from eight possible report layouts to determine the layout of the canvas.
- Each layout contains 1-4 report panes arranged in different ways (see red arrow above).
- Panes can be resized by dragging the pane splitter lines. See Resizing Report Panes below.
- Each pane may be assigned a single report component:
- Grids
- Charts
- Advanced (Visualizations)
- Maps
- Gauges (enabled if KPI measures are in query).
- Text Boxes
- Slicers
- Each component in the report canvas can be customized using the Data Discovery Ribbons.
Slicers in Report Canvas
Slicers can appear in the report canvas in either of two ways.
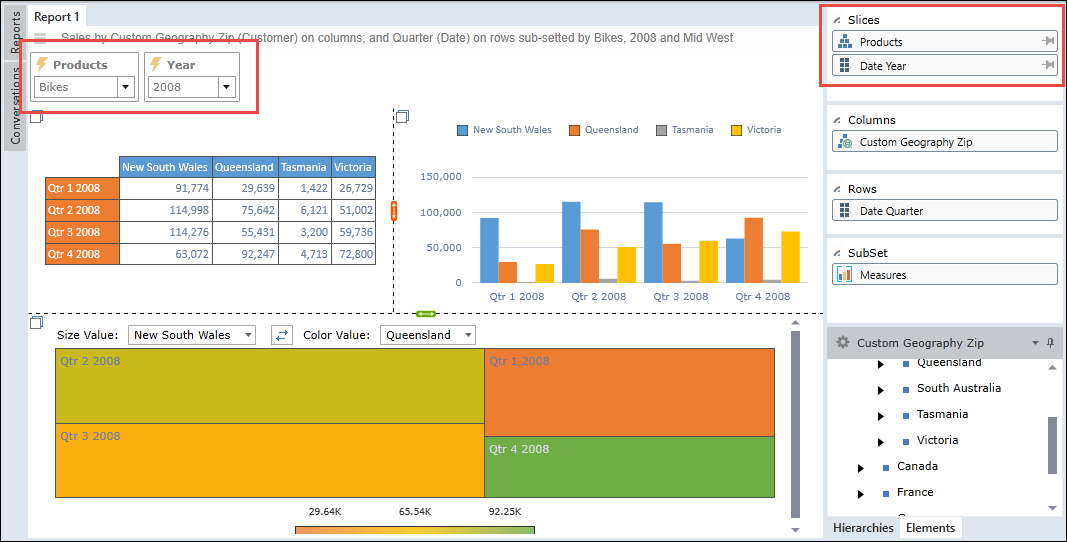
Slicers Associated with Report Pane
If you associate Slicers with one of your report panes, slicers will be displayed inside the respective report pane.
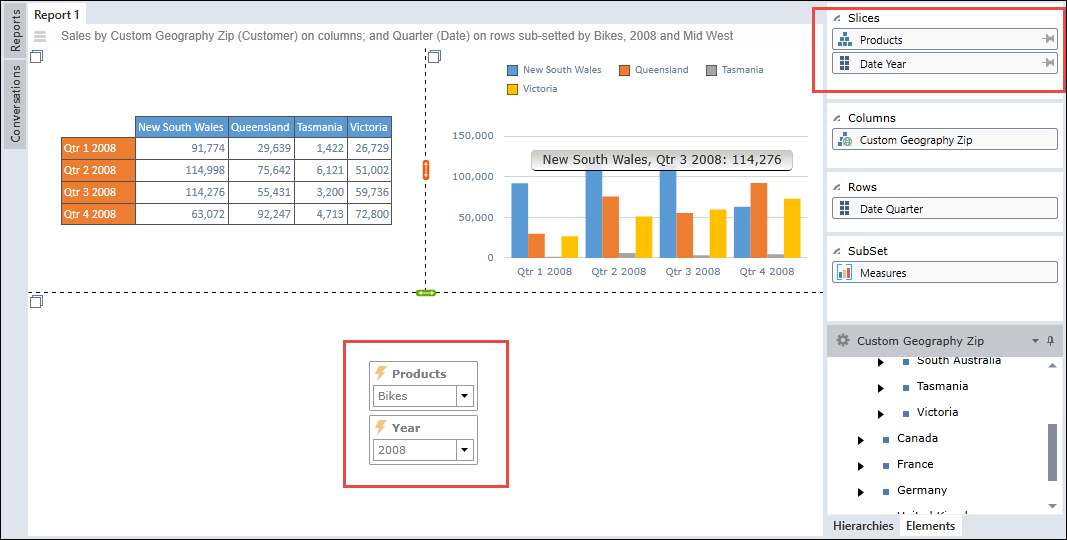
Slicers Not Associated with Report Pane
If you do NOT associate Slicers with one of your report panes, slicers will added at the top of report canvas.
Resizing Report Panes
You can resize the report panes as follows:
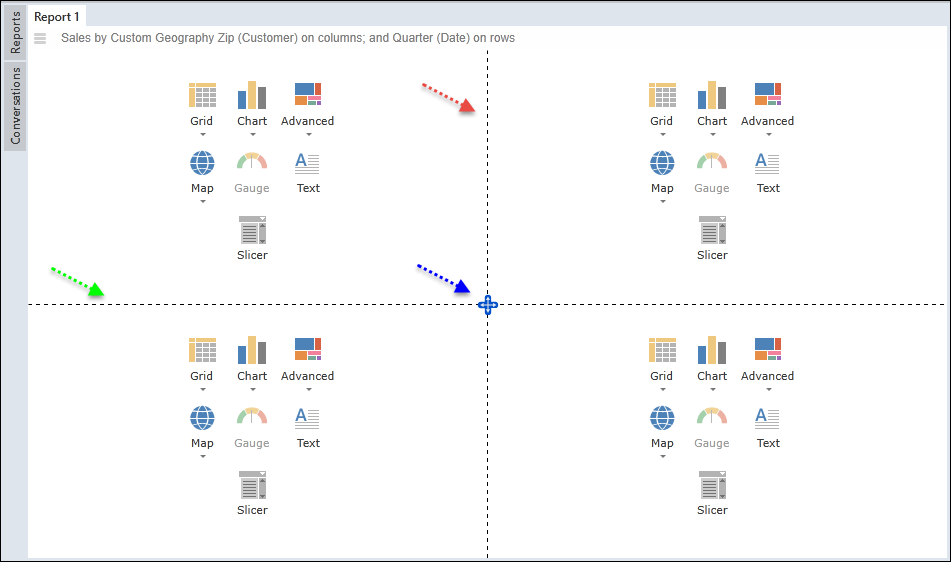
- Drag the horizontal splitter.
- Drag the vertical splitter.
- Drag the center point to use both splitters together (horizontal and vertical).
Use the Locked Mode command in the Report Tab to lock the report layout and hide the splitter lines.
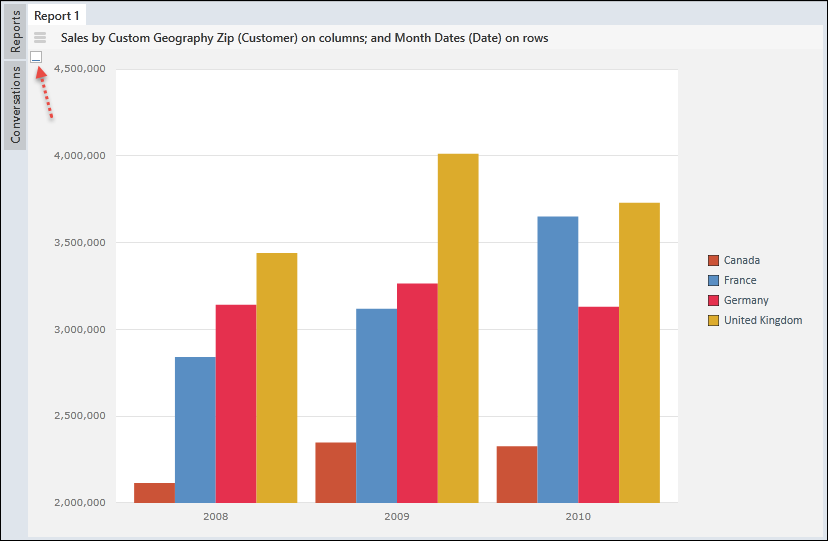
Zooming Report Panes
When working with a report layout that has two or more panes, each individual pane can be zoomed for a full-screen view. To zoom a pane, click on its zoom icon. Click again to unzoom the report pane.
Managing Report Canvas
Each report canvas includes the following features.
Report Title
The main report title appears at the top of the workspace (for example, Report 1).

Report Auto-Title
The report auto-title is located in the header bar and describes the underlying query in plain language. You can change the auto-title header from the Home ribbon.
NOTE: If the data source is approved or 'sanctioned', the certification watermark is shown next to the auto-title (black arrow below).

Report Power Square
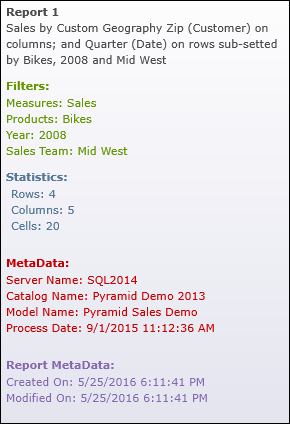
The small square to the left of the report title is known as the Report Power Square.

Hovering over the power square will provide a tooltip containing report info.
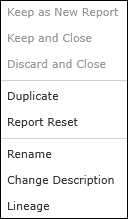
Right-clicking on the power square will present the user with a context menu for managing the report.
Multiple Reports
Click the New Report button in the Home ribbon to create another report. You can work with multiple reports, each having a different report layout. Each report can also have it own unique data source.
Closing Reports
Clicking the "X" in each report to close the report.

At least one report must always be present. So if there is one report only, the "X" will not appear.

Home |
Table of Contents |
Index |
User Community
Pyramid Analytics © 2011-2022